07:31
Technical Analysis : RSI & Bollinger Bands
From the creator
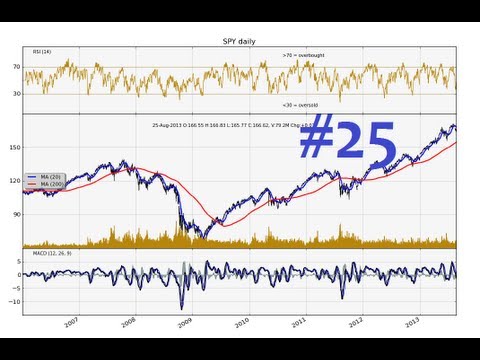
In this video I'll focus on Technical Analysis of the stock market! This is a multipart tutorial series that will show you how to use Python to analyze and search for chart patterns that you can use to make stock market predictions. This video is for people who want to know exactly how to make these calculations easily using real time data and then plot beautiful charts that are customizable. LIVESTREAM OF THIS VIDEO IS HERE : https://www.twitch.tv/derekbanas I Have a Discord : https://discord.gg/VckHCAvA ( Contact Me Anytime ) I will be using Python and Multiple Data Science libraries in this tutorial to perform Technical Analysis. We will be covering the following : ✳️ Relative Strength Index : RSI ✳️ Bollinger Bands ✳️ TA-Lib : 150 Indicators ✳️ Python Technical Analysis Library ✳️ Multiple Subplots ✳️ Numerous Data Science Libraries ✳️ Downloading Realtime Data ✳️ Candlestick Charts ✳️ Making Beautiful Charts ✳️ So much more Files Are Here : https://github.com/derekbanas/Python4Finance [ Look for the File : Technical Analysis 3.ipynb ] MY UDEMY COURSES ARE 87.5% OFF TIL May 1st ($9.99) ➡️ Python Data Science Series: Highest Rated & Largest Python Udemy Course + 56 Hrs + 200 Videos + Data Science https://bit.ly/Master_Python_52 ➡️ C++ Programming Bootcamp Series: Over 23 Hrs + 53 Videos + Quizzes + Graded Assignments https://bit.ly/C_Course_52 ➡️ Golang Course: 15 Hrs + Web Apps + Core Language + Create a Blog + PostgreSQL + Problem Solving https://bit.ly/go-t
Published 2021-12-02 · Watch on YouTube ↗
Availability and playback restrictions are controlled by the original channel.