07:31
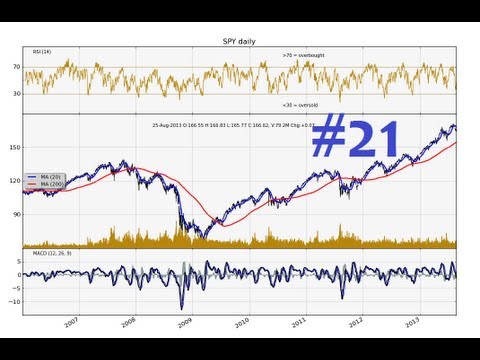
Charting Stocks Part 25 - Customizing RSI, candlestick, MACD, and Volume matplotlib chart
From the creator
This is the twenty-fifth video in the series for stock price analysis, showing you how to customize the RSI, candlestick, MACD, and volume matplotlib stock price graph. The purpose of the videos in this series is to teach you how to program your own charting and technical analysis of stocks or Forex. This is beneficial for you if you plan to do any sort of algorithmic, high-frequency, or any sort of automated trading. Sentdex.com Facebook.com/sentdex Twitter.com/sentdex
Published 2013-09-05 · Watch on YouTube ↗
Availability and playback restrictions are controlled by the original channel.