07:31
Python Finance and Math Tutorials: Ease of Movement introduction
From the creator
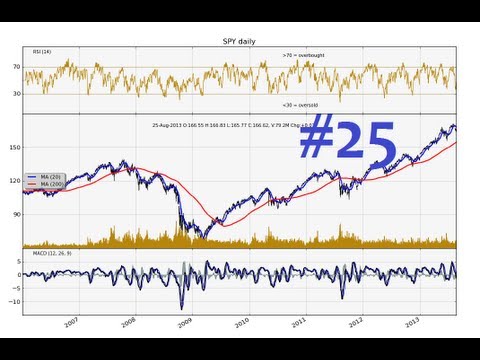
This tutorial video introduces the Ease of Movement stock indicator. The Ease of Movement indicator attempts to measure directional intensity in a security. The purpose of this series is to teach mathematics within python. To do this, we will be working with a bunch of the more popular stock indicators used with technical analysis. With most of the indicators, we will first discuss them, their purpose, then teach how to program them into python, then actually display them on a chart. The basic charting application comes from a previous tutorial series, here: http://www.youtube.com/playlist?list=PLQVvvaa0QuDcR-u9O8LyLR7URiKuW-XZq Required files: Sample Code for the actual charting parts: http://sentdex.com/sentiment-analysisbig-data-and-python-tutorials-algorithmic-trading/python-matplotlib-sample-code-charting-stocks-python/ Python: http://python.org Numpy: http://www.lfd.uci.edu/~gohlke/pythonlibs/#numpy Matplotlib: http://matplotlib.org/downloads.html Percent Change Video: https://www.youtube.com/watch?v=7fIY_5m1yH0 Sentdex.com Facebook.com/sentdex Twitter.com/sentdex
Published 2013-12-03 · Watch on YouTube ↗
Availability and playback restrictions are controlled by the original channel.