07:31
Pandas with Python 2.7 Part 6 - Data visualization with Matplotlib
From the creator
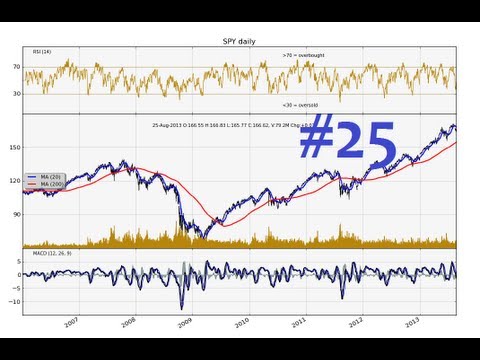
One of the most powerful aspects of Pandas is it's easy inclusion into the Matplotlib module. Matplotlib is a popular and robust Python module that allows programmers to create graphs and charts from their data. Pandas makes loading your data into Matplotlib slightly easier, as well as handles almost all of the processing necessary to get it ready for Matplotlib. Pandas is basically created to do this in the most efficient way possible. Pandas is also quite remarkably good at working with data with dates and Matplotlib. Traditionally, working with data that is indexed by date is somewhat challenging with Matplotlib, but not when using Pandas! Sample code for the series: http://pythonprogramming.net/python-2-7-pandas-data-analysis/ Pandas tutorial series: https://www.youtube.com/playlist?list=PLQVvvaa0QuDfHt4XU7vTm22xDegR0v0fQ http://seaofbtc.com http://sentdex.com http://hkinsley.com https://twitter.com/sentdex Bitcoin donations: 1GV7srgR4NJx4vrk7avCmmVQQrqmv87ty6
Published 2014-07-30 · Watch on YouTube ↗
Availability and playback restrictions are controlled by the original channel.