07:31
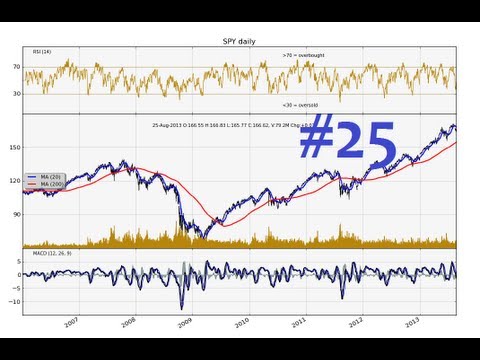
Matplotlib Tutorial 21 - adding more indicator data to our charts
From the creator
In this Matplotlib tutorial, we cover adding a couple simple functions to calculate data for us to fill our axis with. One is a simple moving average, the other is a simple high minus low calculation for prices. sample code: http://pythonprogramming.net http://hkinsley.com https://twitter.com/sentdex http://sentdex.com http://seaofbtc.com
Published 2015-07-12 · Watch on YouTube ↗
Availability and playback restrictions are controlled by the original channel.