07:31
Matplotlib Tutorial 14 - candlestick OHLC graphs
From the creator
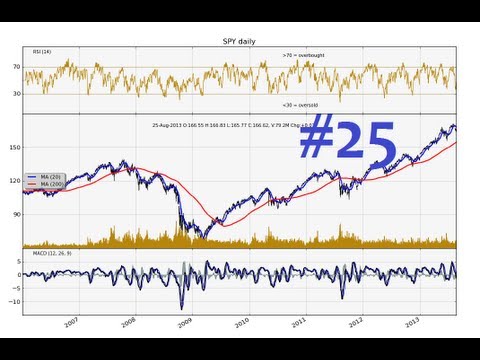
In this Matplotlib tutorial, we're going to cover how to create open, high, low, close (OHLC) candlestick charts within Matplotlib. These graphs are used to display time-series stock price information in a condensed form. sample code: http://pythonprogramming.net http://hkinsley.com https://twitter.com/sentdex http://sentdex.com http://seaofbtc.com
Published 2015-07-12 · Watch on YouTube ↗
Availability and playback restrictions are controlled by the original channel.