07:31
How to modify data granularity in Python for Graphing data in Matplotlib or another application
From the creator
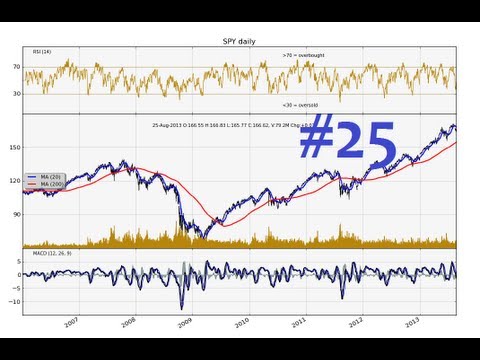
This tutorial video covers how to modify your data granularity. Granularity in graphs refers to the level of detail they contain. Usually, the higher the granularity, the better the quality of the data is. That said, once you pass a certain point, say 10,000 plots on a single graph, the eye can not tell the difference and processing is wasted. Instead, developers should program into their applications granularity adjustments depending on the window that a user is looking. This will show you how to modify how many plots are actually shown on the graph, by averaging them in groups and only plotting up those averages. This will allow you to plot high granularity data sets without waiting for an hour for them to actually generate! They are not moving averages, so there is not lag in the line either, and all data is calculated backwards. Sample code and sample data can be found: http://pythonprogramming.net/modifying-data-granularity-matplotlib/ Sentdex.com Facebook.com/sentdex Twitter.com/sentdex
Published 2013-11-30 · Watch on YouTube ↗
Availability and playback restrictions are controlled by the original channel.