07:31
Adding the MACD indicator - Tkinter tutorial Python 3.4 part 28
From the creator
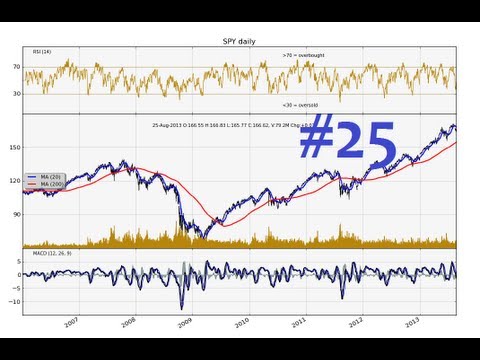
Tkinter GUI TutorialPlaylist: http://www.youtube.com/playlist?list=PLQVvvaa0QuDclKx-QpC9wntnURXVJqLyk This Tkinter GUI programming tutorial covers how to pull and graph the MACD data on our embedded Matplotlib graph in Tkinter. http://seaofbtc.com http://sentdex.com http://hkinsley.com https://twitter.com/sentdex Bitcoin donations: 1GV7srgR4NJx4vrk7avCmmVQQrqmv87ty6
Published 2014-12-12 · Watch on YouTube ↗
Availability and playback restrictions are controlled by the original channel.