07:31
Adding our Historical Earnings to Chart Data Python - Programming for Fundamental Investing Part 17
From the creator
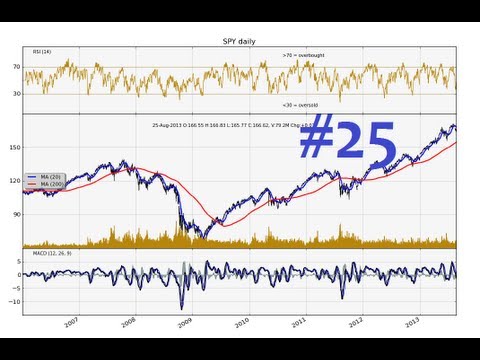
Fundamental Investing Playlist: http://youtu.be/fBEMfugH3OA?list=PLQVvvaa0QuDejNczz7dbpyu3JnwUBvNch This video takes the matplotlib connected to the yahoo finance API to not only chart a candlestick chart with matplotlib, but also chart the RSI and MACD with python. The video takes that and then adds it to the historical financial earnings data found on Quandl.com This entire series focuses on using programming specifically for value investing, just as an example to use throughout the video. Sentdex.com Facebook.com/sentdex Twitter.com/sentdex
Published 2013-10-08 · Watch on YouTube ↗
Availability and playback restrictions are controlled by the original channel.