 01:40
Introducing the Diagnostics Client Library for .NET Core
From the creator
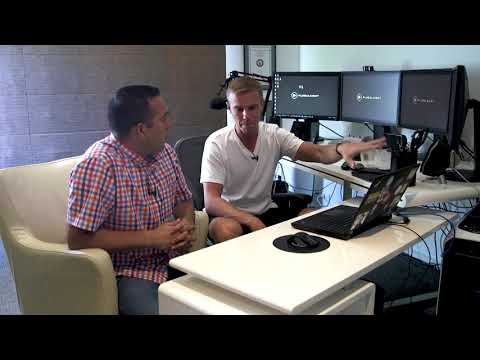
In this episode, we’re joined by Software Engineer Sung Yoon Whang from the .NET Runtime team. He’s here to talk to us about the diagnostics client .NET Core. Using the library, you can communicate with CoreCLR to gather diagnostics dumps from your running application. [01:31] - What is the library for? [03:26] - Creating a custom runtime event tracer - demo [14:34] - Capturing traces from an .NET Core application [17:58] - Dumping traces to a file [20:14] - Who are using these tools? [21:20] - Using PerfView to inspect the dumps [23:49] - Where to learn more? .NET Core runtime diagnostic tools Github repository github.com/dotnet/diagnostics Microsoft.Diagnostics.NETCore.Client API Documentation https://github.com/dotnet/diagnostics/blob/master/documentation/diagnostics-client-library-instructions.md Run-time configuration options for debugging and profiling https://docs.microsoft.com/dotnet/core/run-time-config/debugging-profiling?WT.mc_id=dotnet-c9-cephilli
Published 2020-04-16 · Watch on YouTube ↗
Availability and playback restrictions are controlled by the original channel.
Keep exploring Learn to Code
01:40 19:55
Learn to Code
Announcing General Availability of Azure Bot Service and Language Understanding service
Microsoft Developer
 57:29
 09:02
 18:59
 12:24
Learn to Code
How to provisioning IoT devices at scale with IoT Hub Device Provisioning Service
Microsoft Developer
 14:41
Learn to Code
TWC9: Connect(); On-Demand, Dev’s Guide to Azure, Future Workspace, Furby Hacking and more...
Microsoft Developer